Owner's Own Bill

Last month my roof generated $236.80 of power, and my bill came out to -$109.98.

This is my house. 9.56 kW across four roof faces. I would not sell a system I would not put on my own roof.

Show me how a bill goes negative

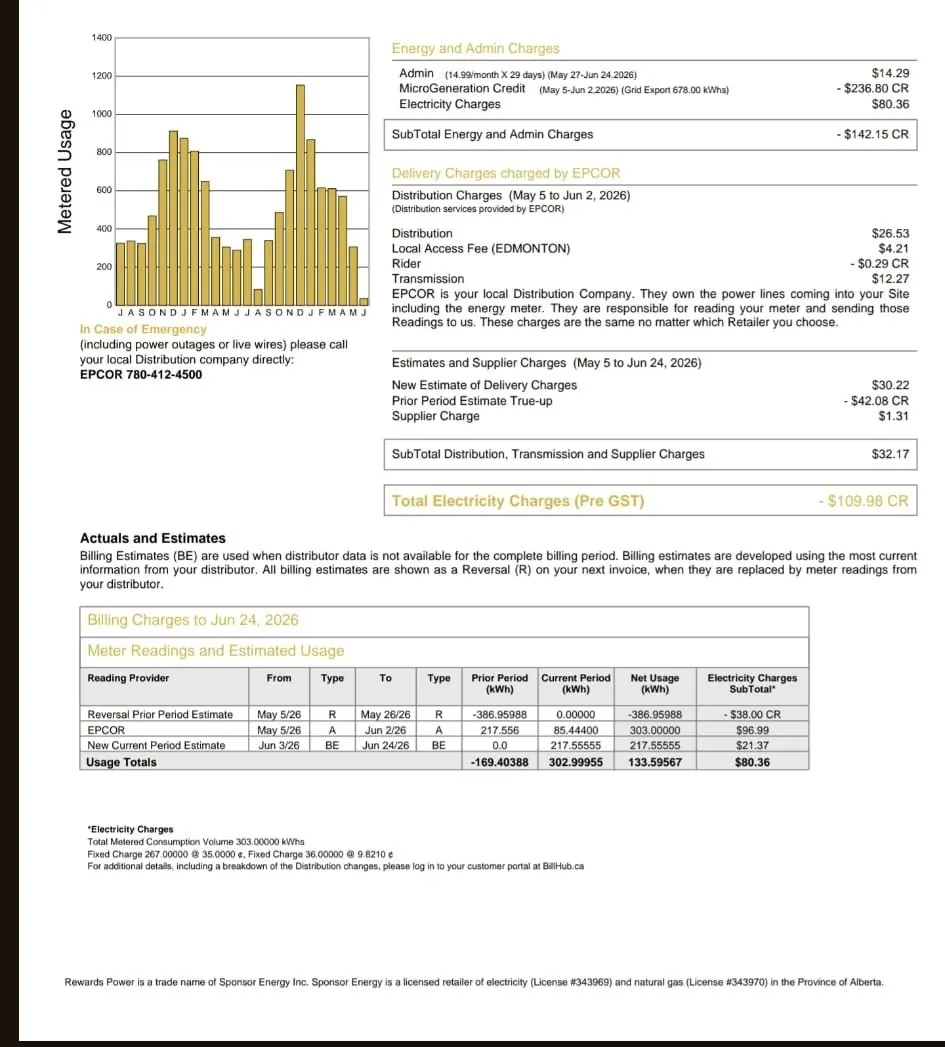
May 5 to June 2, 2026. I exported 678 kWh at roughly 35¢ per kWh on the Rewards Power plan, so the grid credited me $236.80 for the energy alone. After the fixed delivery and admin charges everyone pays, the bill still landed at negative $109.98.

$236.80
Power generated, 1 month
~35¢/kWh
Rewards Power export rate
-$109.98
Net bill, after grid fees
Aerial view of Dmitry Naboka's Edmonton home showing all four solar array sections installed by Raydn Renewables
Dmitry's house · west Edmonton

5.0 · 70+ five-star Google reviews

Two months, two credits

And then it happened again.

Same house, same roof, same meter. Swipe to compare. The full line by line breakdown is right below.

May 5 to Jun 2, 2026

First credit bill

$109.98They owed me

678 kWh sent back to the grid at about 35¢ a kWh.

Exported678 kWh
Credit earned$236.80
Grid power and admin$94.65
Delivery and supplier$32.17
Net electricity-$109.98
Read this bill, every line item

Jun 3 to Jul 2, 2026

It got bigger

$114.10They owed me

771 kWh back at 35¢ flat. The credit swallowed the gas bill too.

Exported771 kWh
Credit earned$269.85
Grid power and admin$110.64
Delivery and supplier$45.11
Natural gas$94.70
Whole house, amount due$0.00
93 kWh more, 14 percent Read this bill, every line item

August bill, pending

I am posting every one of these as it lands. December is going to look ugly and I will post that one too.

Swipe or drag to compare

Four years of data. Nothing smoothed.

31,581 kWh off my own roof since September 2022.

I did not model this and I did not average it out of a brochure. I read it off my own inverter on August 6, 2026. APsystems ECU, serial 216200032405. Every number below came off that box, on my house in Edmonton.

31,581kWh total
47months on record
1,358best month, July 2026
3worst month, Dec 2025

Yearly totals, straight off the inverter

2022 partial1,473 kWh 12.1 kWh a day
20238,423 kWh 23.1 kWh a day
20247,815 kWh 22.0 kWh a day
20258,390 kWh 23.5 kWh a day
2026 partial5,480 kWh 26.4 kWh a day

2022 starts in September, that is when I commissioned it. 2026 is year to date. The three full years land within 600 kWh of each other. Boring, and it repeats. That is the real argument for solar here.

The full recordAll 47 months, one bar at a timeNothing averaged, nothing dropped.
03006009001200 kWh Sep 2022: 828 kWhOct 2022: 559 kWhNov 2022: 81 kWhDec 2022: 5 kWhJan 2023: 21 kWhFeb 2023: 179 kWhMar 2023: 788 kWhApr 2023: 1,073 kWhMay 2023: 1,326 kWhJun 2023: 1,221 kWhJul 2023: 1,155 kWhAug 2023: 1,036 kWhSep 2023: 767 kWhOct 2023: 475 kWhNov 2023: 248 kWhDec 2023: 134 kWhJan 2024: 58 kWhFeb 2024: 266 kWhMar 2024: 496 kWhApr 2024: 973 kWhMay 2024: 1,079 kWhJun 2024: 1,242 kWhJul 2024: 1,279 kWhAug 2024: 1,034 kWhSep 2024: 831 kWhOct 2024: 438 kWhNov 2024: 119 kWhJan 2025: 29 kWhFeb 2025: 114 kWhMar 2025: 538 kWhApr 2025: 1,149 kWhMay 2025: 1,287 kWhJun 2025: 1,310 kWhJul 2025: 1,271 kWhAug 2025: 1,102 kWhSep 2025: 840 kWhOct 2025: 522 kWhNov 2025: 225 kWhDec 2025: 3 kWhJan 2026: 21 kWhFeb 2026: 265 kWhMar 2026: 469 kWhApr 2026: 892 kWhMay 2026: 1,236 kWhJun 2026: 1,019 kWhJul 2026: 1,358 kWhAug 2026: 220 kWh 20222023202420252026 1,358 kWh 3 kWh

Swipe the chart sideways to read all 47 months.

Monthly production, September 2022 to August 2026. August 2026 is still running. Yearly totals come straight off the app. Individual months are read from the same charts and land within about 2 percent.

Now the part most installers skip.

December 2025 my panels made 3 kWh. For the entire month. Snow on the array, sun barely up, and I live here too. Seven months later July made 1,358.

That is Alberta. Anybody who shows you a June number and quietly skips December is selling you the good half. Solar here is an annual game, not a monthly one.


What that power is actually worth in dollars.

31,581 kWh times 35 cents is $11,053. I sat on that number for a long time instead of printing it, because a lifetime dollar figure is the easiest thing on a solar site to break, and I would rather show you a smaller number that holds.

$11,053all 31,581 kWh, priced at today's rate
$2,936one full year, 2025 at the same rate
$224.08cash the utility has actually paid me

Read $11,053 as what the power is worth at today’s rate, not as cash in my pocket. The only number on that row the utility has actually paid me is the $224.08.

The part I could have fudgedWhy one rate is honest here, and what $11,053 is notImport and export both priced at 35.0 cents, checked on the July statement

The problem I had to solve first.

Power I burn in the house and power I ship out to the grid are two different transactions. The house one avoids what I would have paid to buy it. The grid one earns an export credit. If those two rates are different, then one blended number across 31,581 kWh is a lie, and a sharp buyer would catch it.

On my account they are not different. My July statement charged me for 267 kWh of imported power at $93.45. Divide it out and that is 35.00 cents per kWh. The same statement credits my exported power at 35.0 cents. Same rate, both directions. So it does not matter whether a kilowatt hour went into my fridge or out to my neighbour's. It was worth 35 cents either way, and that is the one reason a single rate is defensible here.

35 cents is the rate on my July 2026 statement. The rate in 2022 was not 35 cents, so read $11,053 as what that power is worth at today’s price, which is the price you would be buying into. It covers energy only. That same July bill still carried $62.30 of fixed and delivery charges that solar does not touch, which is exactly why the bill lands at -$114.10 and not at -$176.40.

Same 31,581 kWh, counted in carbon.

And what it kept out of the air.

There is a trap in this one too. What matters is how dirty the grid was that my power replaced, and most solar math you will read is quietly years out of date on that.

10.6 tCO2 kept off the Alberta grid
25barrels of oil, matched on carbon
176tree years of sequestration

I used Alberta’s 2024 grid factor of 335 g CO2 per kWh. The older 490 g table still floating around would have let me print 15.5 tonnes. Tree years are not trees.

Every factor, and the one I refused to useHow the 10.6 tonnes was worked outFour sources, all linked, all accessed August 7, 2026

Why my number is smaller than the one you will see elsewhere.

Alberta burned its last coal in June 2024. The grid got cleaner very fast, which is good news that happens to make solar look less impressive, so an old emissions factor overstates the offset badly.

The latest federal inventory puts Alberta’s grid at 335 grams of CO2 per kWh generated in 2024, down from 907 grams in 2005. I used 335. There is an older federal table still floating around that would let me claim 490 grams, and it would have handed me 15.5 tonnes instead of 10.6. I did not use it, because it is built on 2022 data and 2022 still had coal in it.

25 barrels is how much crude you would have to burn to put the same 10.6 tonnes into the air, at the published factor of 0.43 tonnes per barrel. It is matched on carbon, not on energy content, so it is not a claim that my roof made 25 barrels of oil.

The tree number is the one I want to be careful about, because almost everybody rounds it the wrong way. The published factor is per tree per year, not per tree forever. So 176 is tree years. Call it 18 trees doing the job for a full decade. If somebody tells you a 9.56 kW roof saves 176 trees, they are out by a factor of ten, and now you know how to check them.

Sources, so you can check every one of these yourself. Alberta grid intensity of 335 g CO2e per kWh for 2024, from Environment and Climate Change Canada’s National Inventory Report 1990 to 2024, Annex 7, Table A7-10, as published by the Government of Alberta. The older 490 g figure I declined to use is Table 5.2 of Emission Factors and Reference Values v2.0, ECCC, May 2024. Oil at 0.43 tonnes CO2 per barrel and trees at 0.060 tonnes CO2 per urban tree per year, both from the US EPA equivalencies calculator, which publishes its full arithmetic. Natural Resources Canada runs an equivalencies calculator but does not publish the underlying tree or barrel factors, so I used the American ones and I am telling you that rather than hiding it. All three accessed August 7, 2026.
That is the power and what it is worth, in dollars and in carbon. The actual statements, with the credits printed on them, are next.

The same roof, one day at a time

What one average day off my roof actually does.

Not my best day. This is every single day of 2023, 2024 and 2025 averaged out, December and snow cover included.

While you have had this page open, that same rate has kept 0.0 g of CO2 out of the air.

45 trees is not 45 trees saved. Nothing gets cut down either way. It is how many trees you would need pulling carbon out of the air all day to match what my roof does in that day.

The arithmetic, so you can check itWhere 22.5 kWh a day comes fromThree complete years off the inverter, divided by 1,096 days

Why I threw away two of the five years.

I have 47 months of record, but 2022 starts in September and 2026 is not finished. Averaging a partial year in tilts the number toward summer, which would flatter me. So I used only the three complete calendar years the inverter has printed: 8,423 plus 7,815 plus 8,390 is 24,628 kWh over 1,096 days. That is 22.47 a day, and it carries December in it, including the month my roof made 3 kWh.

The carbon is 22.47 kWh times Alberta’s 335 grams, which is 7.5 kg a day. The oil is that 7.5 kg divided by the 430 kg a barrel of crude puts out, then converted to litres, so 2.8 L. It is matched on carbon, not on energy content. My roof does not make oil.

Trees are the one worth checking me on. Two honest methods land either side of 45. Daily carbon divided by what one tree absorbs in a day gives 45.8. The 176 tree years above, spread across the 3.93 years the record covers, gives 44.9. I print 45 and I am telling you the spread rather than picking whichever one looked better.

Production is off my own APsystems ECU 216200032405, annual totals as printed by the app, captured August 6, 2026. Alberta grid intensity of 335 g CO2e per kWh for 2024 is Environment and Climate Change Canada’s National Inventory Report 1990 to 2024, Annex 7, Table A7-10, as published by the Government of Alberta. Crude at 0.43 tonnes CO2 per barrel and trees at 0.060 tonnes CO2 per urban tree per year are both from the US EPA equivalencies calculator, same two factors used in the carbon breakdown above. A barrel is 158.987 litres. Accessed August 7, 2026.

The Receipt

Read the bill yourself. Every line item.

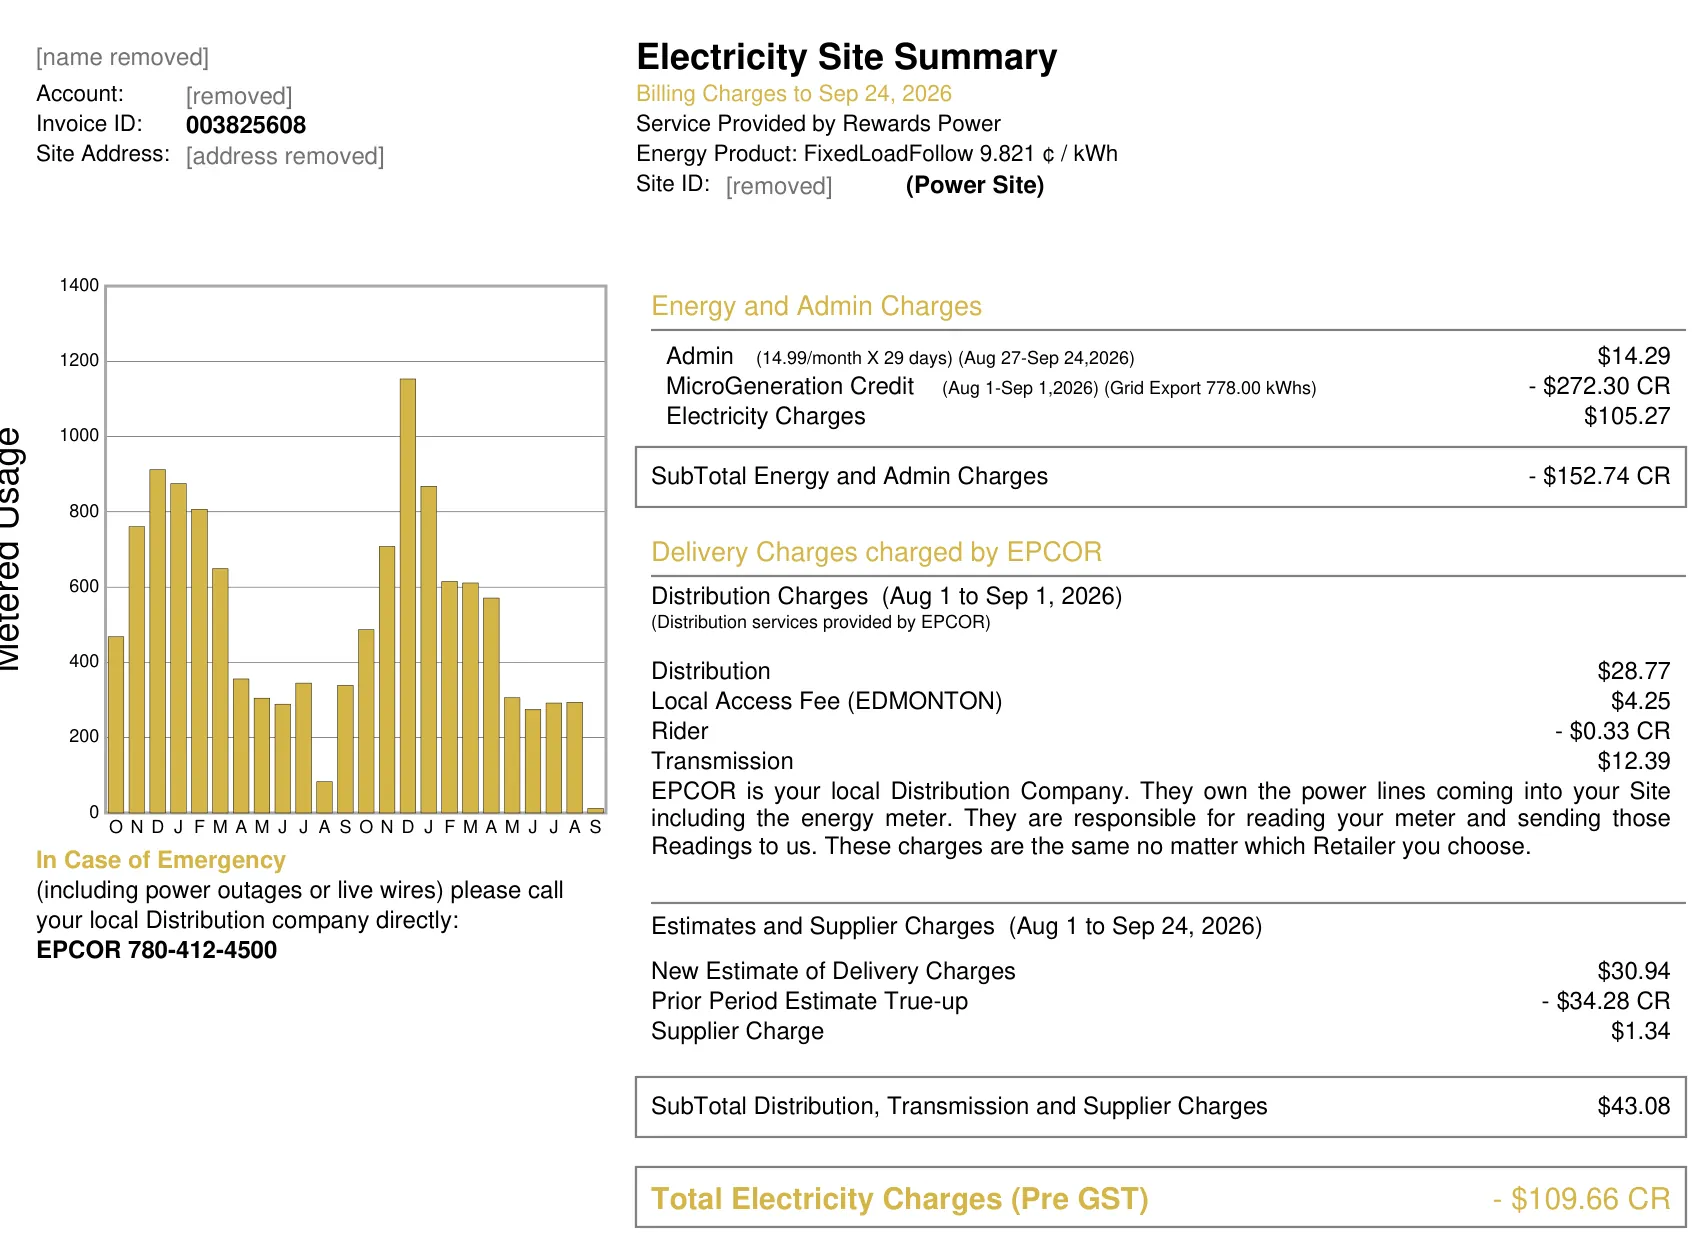
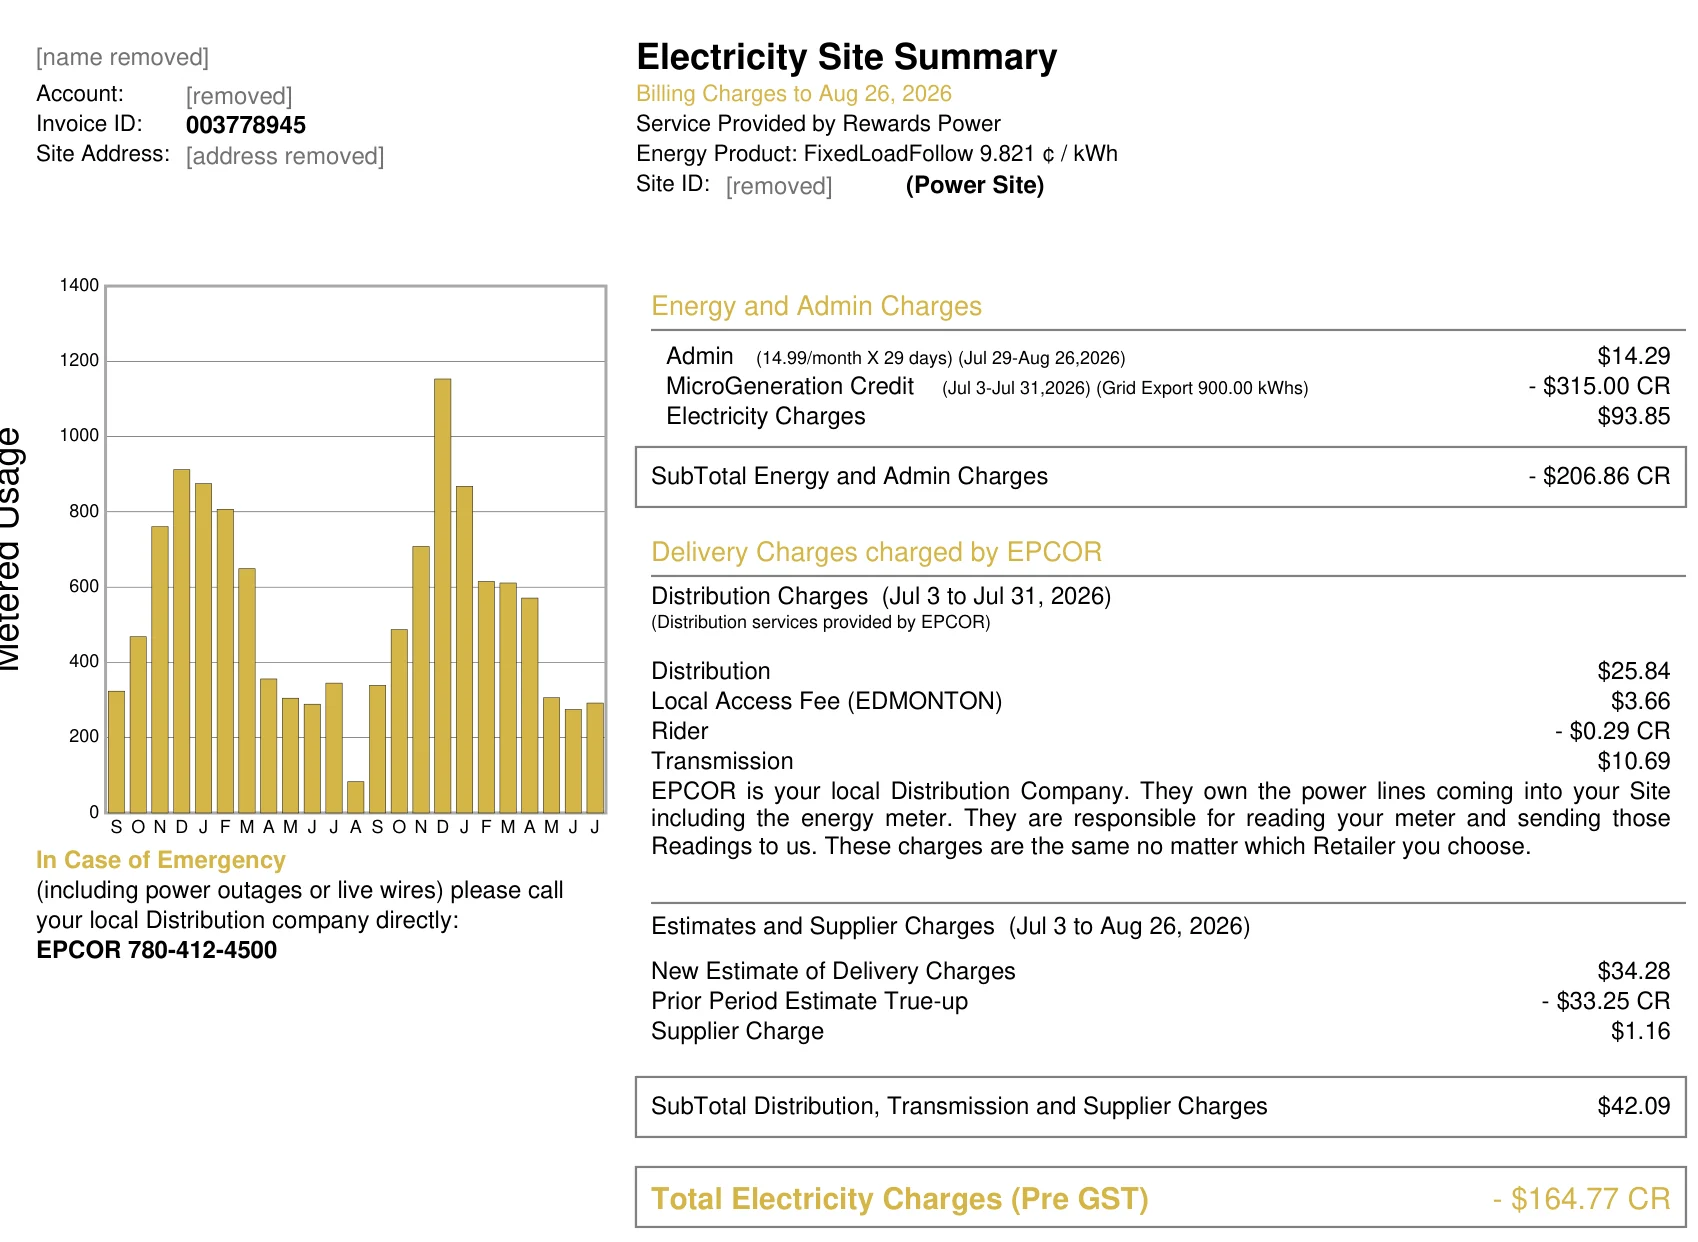
This is a screenshot from my online power account, charges page, May 5 to June 2, 2026 billing period. I have redacted my address and account number. Every dollar figure is exactly what my retailer sent me.

My own power bill for the May 5 to June 2, 2026 period, showing total electricity charges of -$109.98 CR. EPCOR is the distributor on the delivery lines, not the issuer.
Admin charge14.99/mo × 29 days
$14.29
MicroGeneration Credit678 kWh exported to the grid
-$236.80
Electricity ChargesFor the kWh I did pull from the grid
$80.36
Subtotal: Energy and Admin
-$142.15
DistributionEPCOR fixed wires-and-poles charge
$26.53
Local Access Fee (Edmonton)
$4.21
RiderEPCOR recovery of costs not in the approved rates
-$0.29
Transmission
$12.27
New estimate of delivery chargesMay 5 to Jun 24, 2026
$30.22
Prior period estimate true-upEPCOR reverses last month’s estimate
-$42.08
Supplier chargeUnaccounted for electricity and system losses
$1.31
Subtotal: Distribution and supplier
$32.17
Total Electricity (pre-GST)
-$109.98

Source: my own online power account, May to June 2026 billing period. Numbers add: -$142.15 energy credit + $32.17 fixed delivery and supplier = -$109.98 net. That credit then covered my gas bill, and the household paid roughly -$12 for the month.

5.0 on Google · 70+ verified reviews

What solar customers say

These are Google reviews, copied word for word. Real Alberta solar jobs, real names, nothing edited.

★★★★★
“If you're considering solar, look no further than Raydn Renewables. Dima and his crew were professional, knowledgeable, and trustworthy from start to finish. From the moment he walked through the door, the service was handled with care and by the time the job was done, he hadn't just met my expectations, he'd blown past them. The whole team clearly takes pride in their work and genuinely cares about their customers. I felt confident every step of the way. If you're looking for a solar company you can actually trust, Raydn Renewables is it. Highly recommend!”
Keirnen · Verified Google review
★★★★★
“We were having some ongoing issues with the solar system that another company originally installed a while back. I called Raydn Renewables to come out and do some maintenance to see if they could sort it out. Dmitry showed up on time, tracked down the problem quickly, and got everything working exactly the way it should be. He took the time to answer all of our questions and explained the fix without any of the usual contractor runaround. It's hard to find tradesmen who show up, do clean work, and actually know their stuff inside and out. If you need reliable solar maintenance or a solid electrician in Alberta, I'd highly recommend Dmitry and the Raydn team. Honest guys, great service, and zero BS.”
Arttus · Verified Google review

Swipe sideways for 1 more →

Read all 70+ reviews →

The Monitoring App

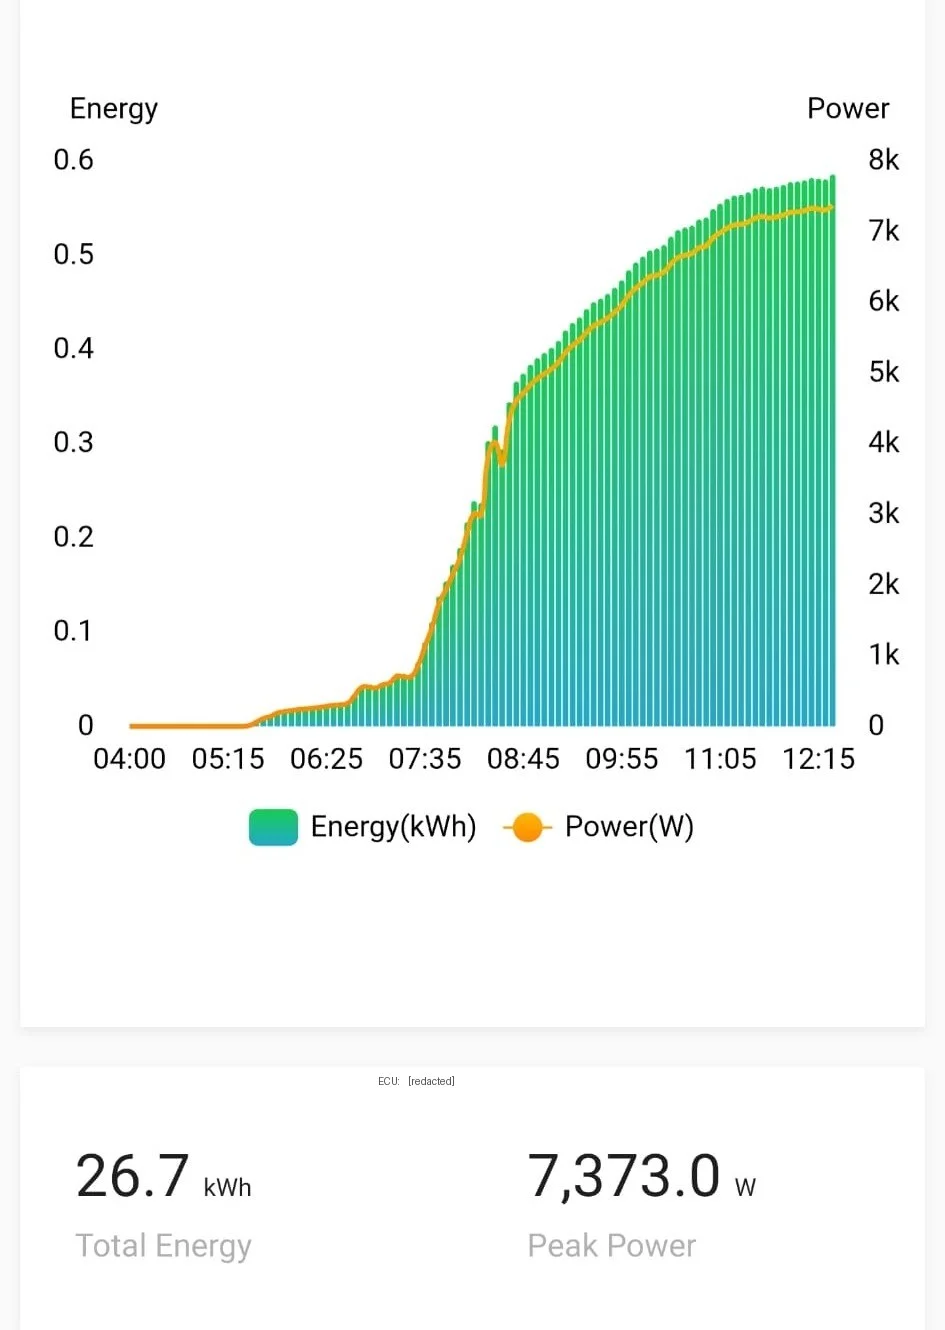
26.7 kWh in a single morning. Live from my own roof.

Every Raydn system gets per-panel monitoring through APsystems. I look at the same dashboard you would after install. This screenshot is mine, June 2026, from sunrise to lunch.

APsystems monitoring app showing solar production curve from 4am to noon, peaking at 7.3 kW
7.37 kW
Peak power at noon (77% of nameplate)
26.7 kWh
Energy generated by 12:15 PM
31,581 kWh
Lifetime production off my own roof, September 2022 to now.

My own roof, my biggest testimony

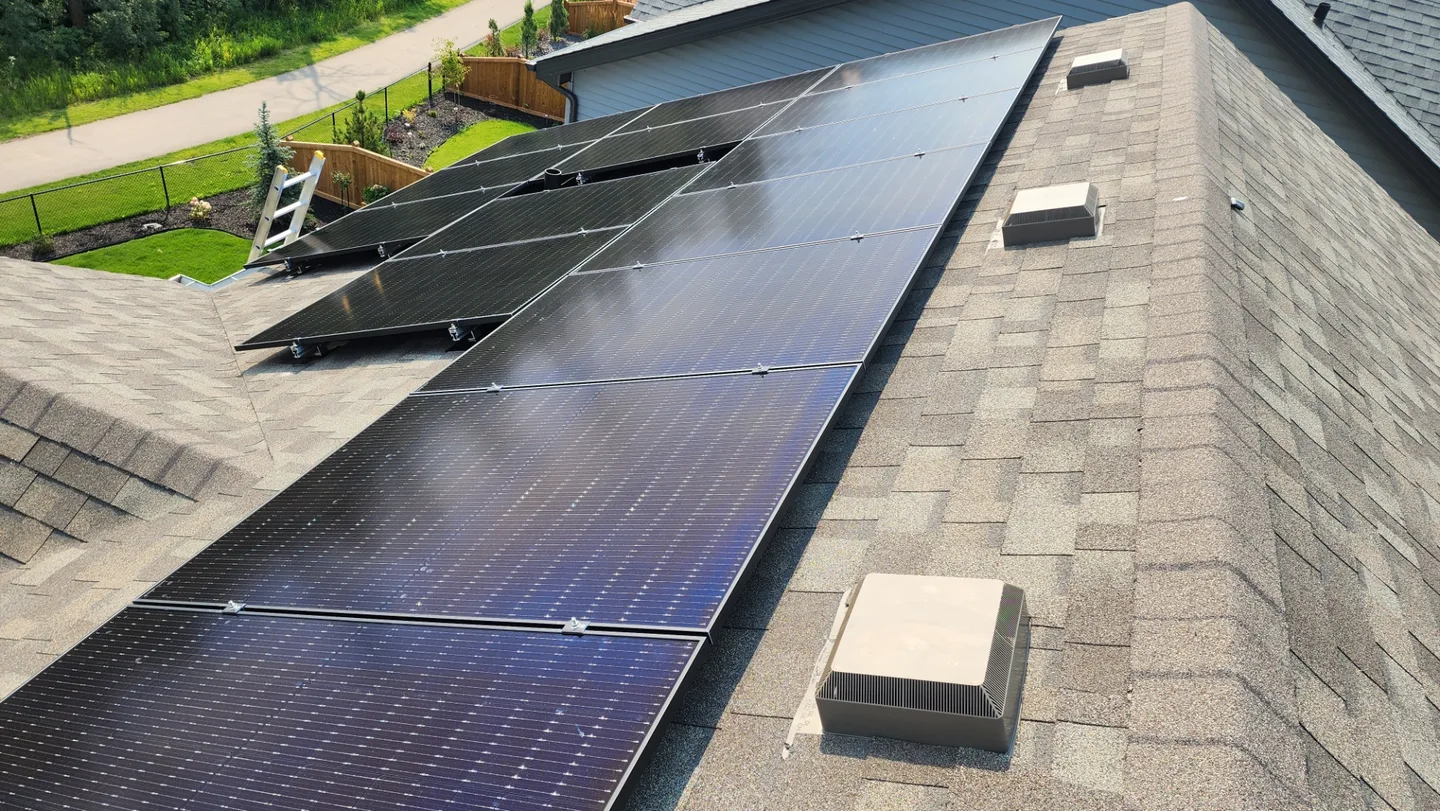
Installed on my own house in 2022. Four years on, not a single cable touching the roof.

  1. I did my own roof exactly the way I do yours.
  2. Every panel floating flush, every run tucked underneath, nothing draped across the shingles and nothing hidden behind a conduit guard to cover up messy cable management.
  3. That is the single biggest flex I offer, and it has been monitored live every day since 2022 with zero panels down.
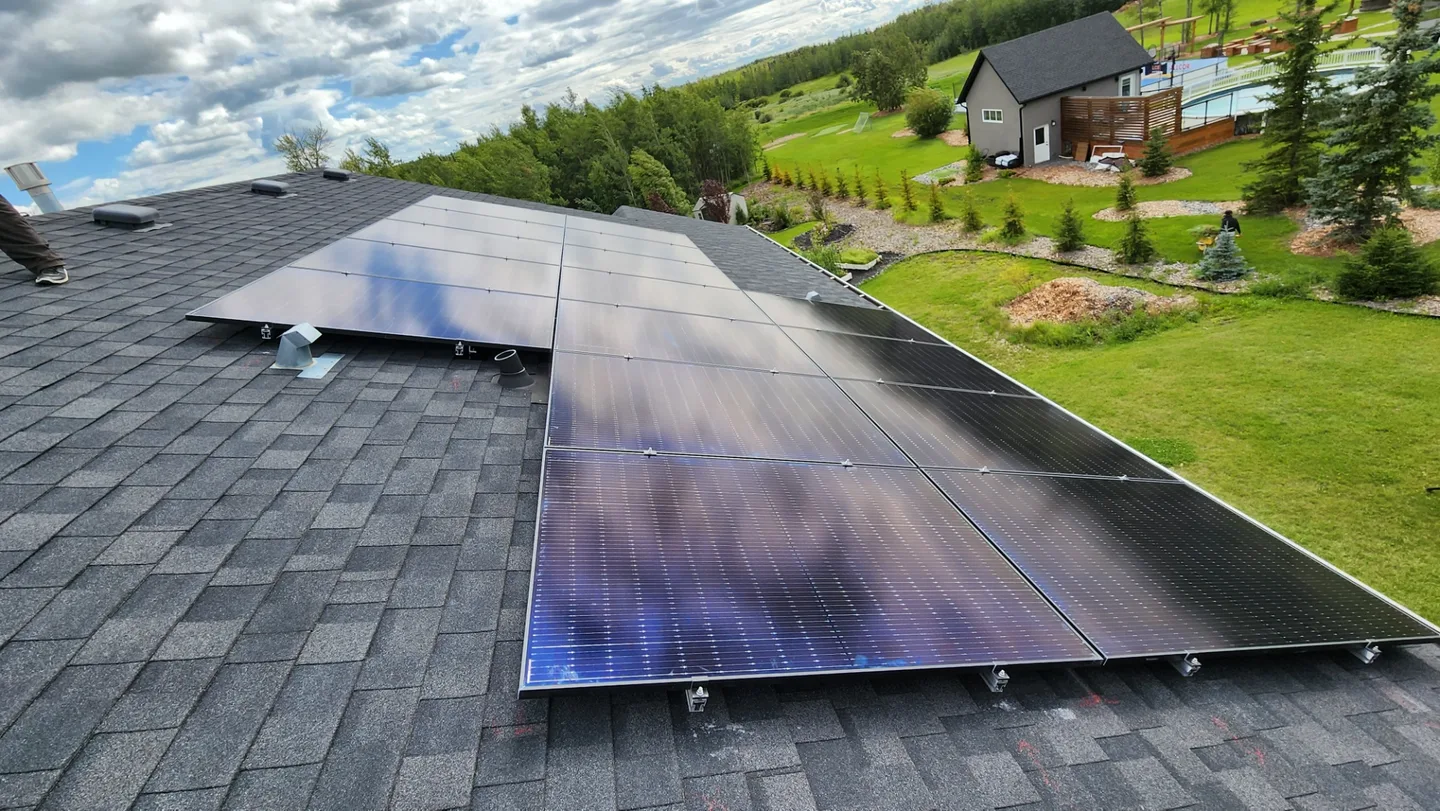
Aerial of Dmitry's own Alberta home solar array, all-black panels sitting flush on the roof with no cables visible across the shingles
My roof, aerial. No conduit across the shingles, every wire routed underneath.
Dmitry's home solar panels floating flush on the roof face, clean cable management with nothing touching the shingle surface
Panels floating flush, so you can walk the whole perimeter and never see a wire.
Come inspect it yourself

Any homeowner, skeptic, or competitor is welcome to see it. I will set up the ladder and you can climb up and check the install yourself, or look through the install photos. I welcome the criticism.

See the install photos

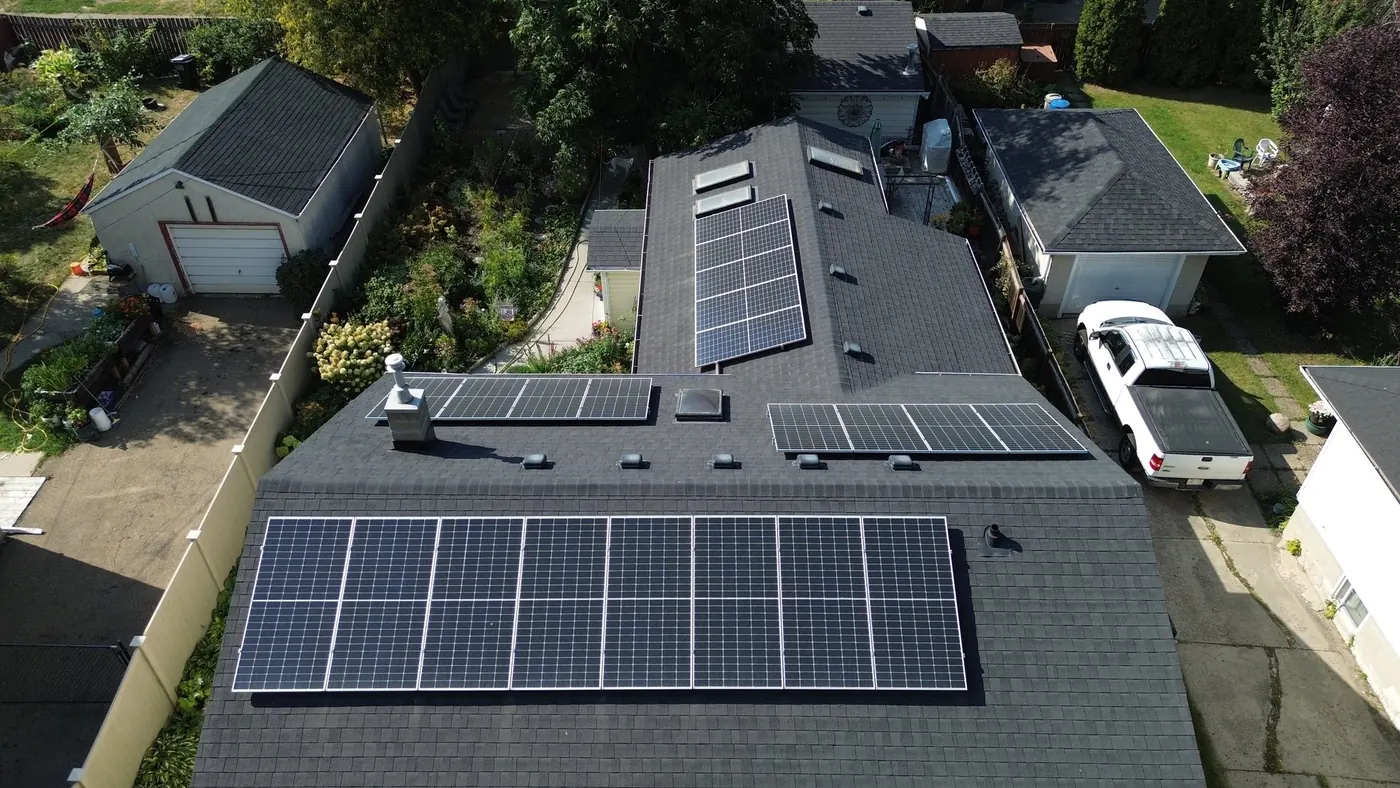
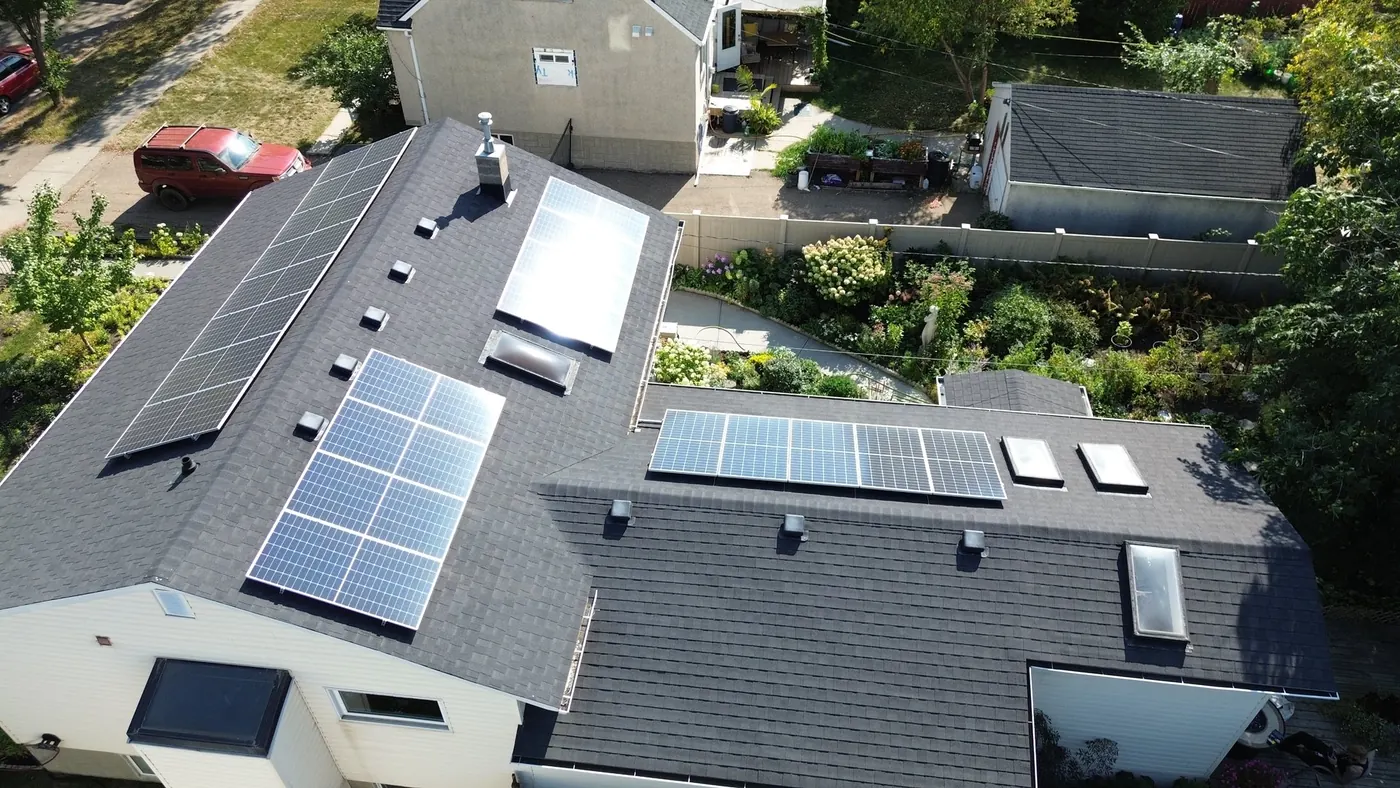
How a 9.56 kW system fits on four different roof faces

Vertical aerial of Dmitry's home showing the long west array and the middle dormer array
  • 01

    Long west-side array (12 panels)

    Why this face

    Catches late-afternoon and early-evening sun, when most homes have someone home running appliances. Pure azimuth match for residential load curves.

  • 02

    Front dormer south face (10 panels)

    Why this face

    The classic prime real estate. Highest summer output per panel. APsystems microinverters mean shading on one panel does not drag the rest down.

  • 03

    Upper rear pitch (6 panels)

    Why this face

    A typical roofer would tell you this section is "too small to bother with." Six panels here add roughly 1.4 kW. That is enough to run a heat pump on a sunny day.

  • 04

    South-east garage face (12 panels)

    Why this face

    Morning yield. Different microinverter string from the other arrays so each face runs at its own maximum power point. This is why APsystems instead of a single string inverter.

What the bill does not show

A bill in credit is the headline. Here is the rest of the truth so you can make an honest decision.

Winter months are not like this

May through August carry the year. November through February I import more than I export. The number that matters is the 12 month total, and mine sits at roughly net zero electricity for the year, before incentives.

There is still a fixed monthly charge

EPCOR distribution, local access fee, transmission and admin add up to roughly $30 to $45 a month no matter how little energy you draw. That part does not go to zero even when your energy charges do. Plan for it.

The system was not free

Out the door, a 9.56 kW system at my size runs in the high twenties to low thirties depending on roof complexity. CEIP financing at 6% fixed makes the monthly payment lower than the bill it replaces. The payback math is in the calculator, not in this page.

Your roof might not do this

If you have a north-only roof, heavy shade, or a complex hip layout, your number will be lower than mine. That is exactly why I walk the roof before I write a quote.

Want to know what your bill could look like?

I will walk your roof, check your attic, and audit your panel before I write a number down. That is the on-site visit. Free, no obligation, and you get the proposal on a real spreadsheet, not a marketing brochure.

Trusted Raydn Network · Rewards Partner

Lower your bill before solar even arrives

Reward Power by BillHub · Alberta electricity and gas retailer

We use this program ourselves and recommend it. Apply through our referral link here: Start your application.

Disclosure: We may receive a small referral credit when you sign up through this link. We use Reward Power on our own homes.

Scan to open the Reward Power application

Scan or click to apply

Where these numbers come from

The export credit rate figures come off the Solar Club July 2026 fact sheet, read 27 August 2026. Under 150 kW the same rate applies to power you buy and power you export, which is the whole reason the plan you are on changes your numbers.

The 6.0 percent CEIP rate, the $3,000 to $50,000 residential range, and the term cap all come off the City of Edmonton page for the program, Clean Energy Improvement Program, read 27 August 2026. The city publishes it as the rate for the current tranche, and it is fixed for your whole term once your agreement is in place. The city also caps the term at the lesser of 20 years or the useful life of the upgrades.

Every rate on this page is a published third party figure or is labelled as our own estimate. If one of these has moved since the read date, tell me and I will correct the page.

Honest quote in 24 hours